Professional Women's Drill Size Tool & GPS Metrics
Scroll down to the bottom right-hand side of the Drill Size Tool (Looker) and go to full screen for the best interactive experience. This Tool is four pages.
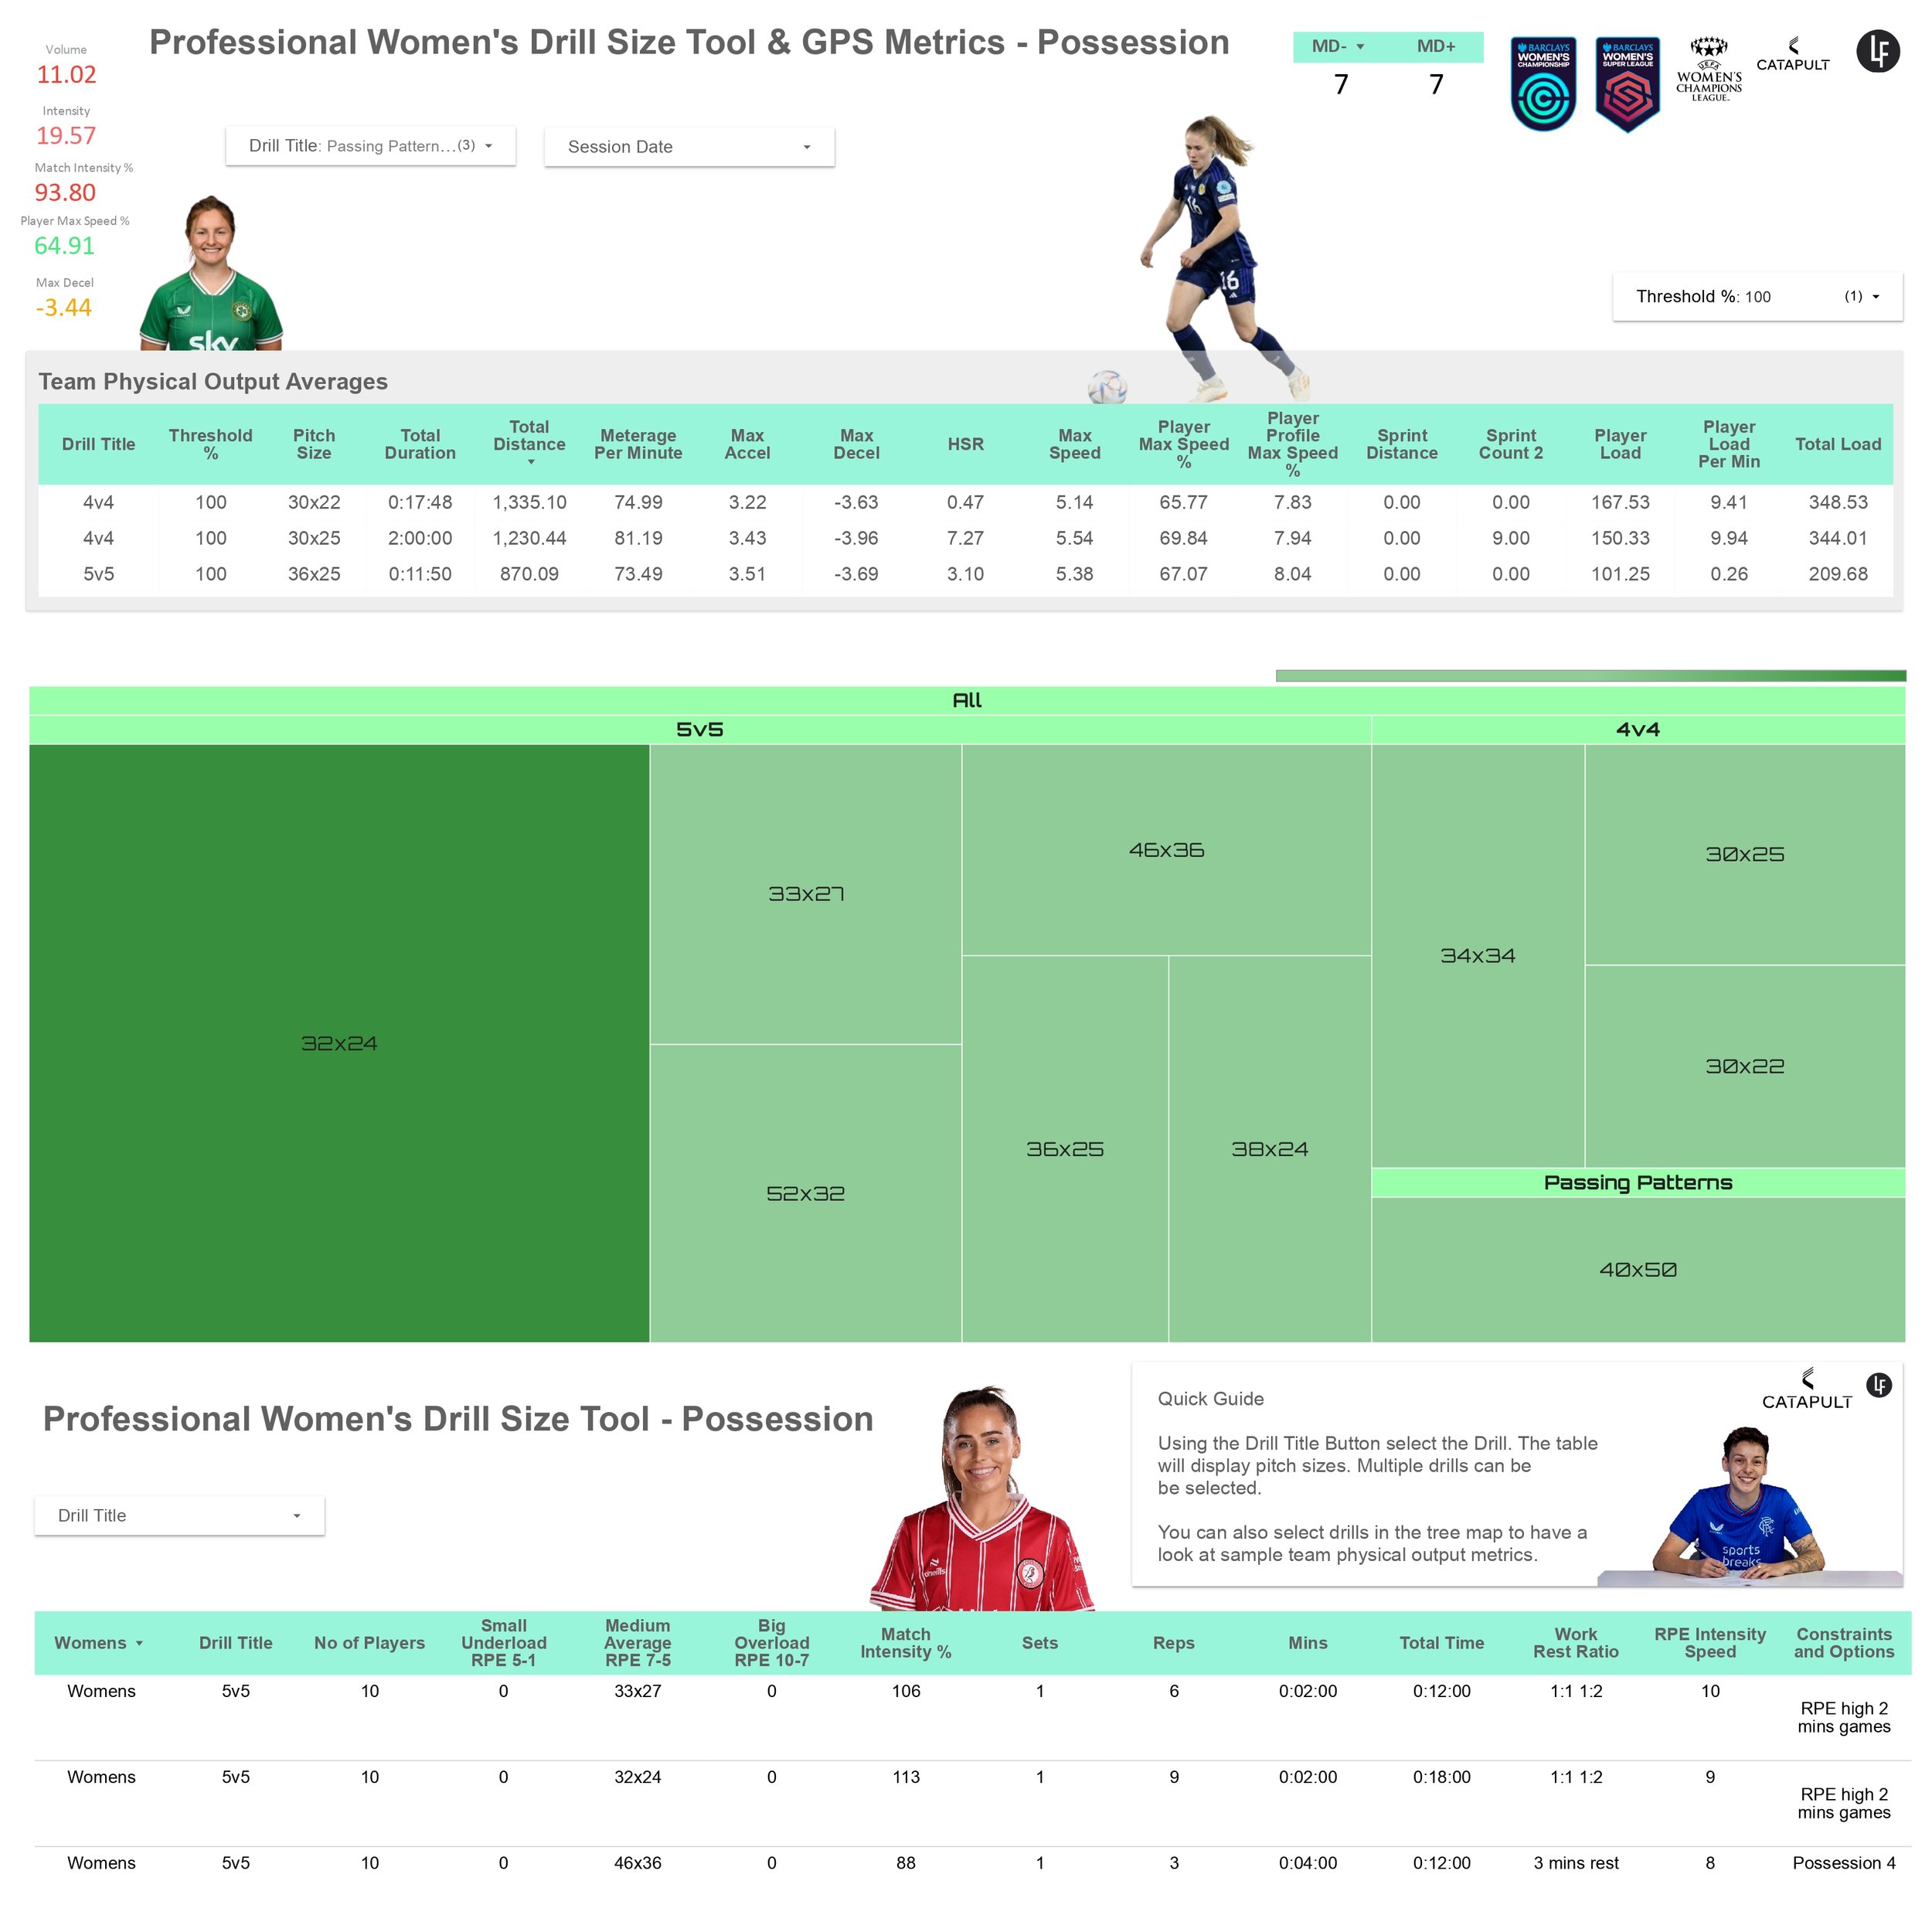
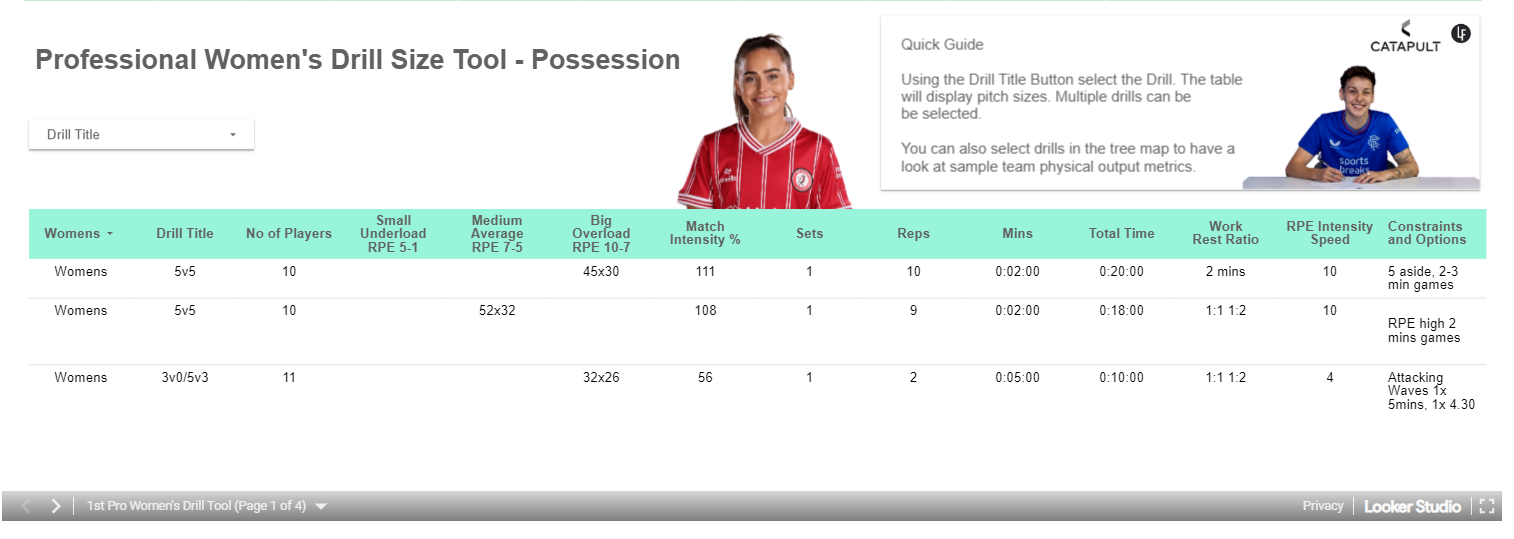
This is sample data from seasons starting from 2022 and 2023 from English Professional Women’s Football. This tool emphasises the physical demands specific to Women and Girls. Please view these tools through that lens. All the variables shown in the dashboard are adjustable and flexible. Please see everything as a guide. The GPS metrics are examples of team average physical outputs for a variety of sessions. The first drill table provides drill percentage thresholds, pitch size options and gps metric variables.
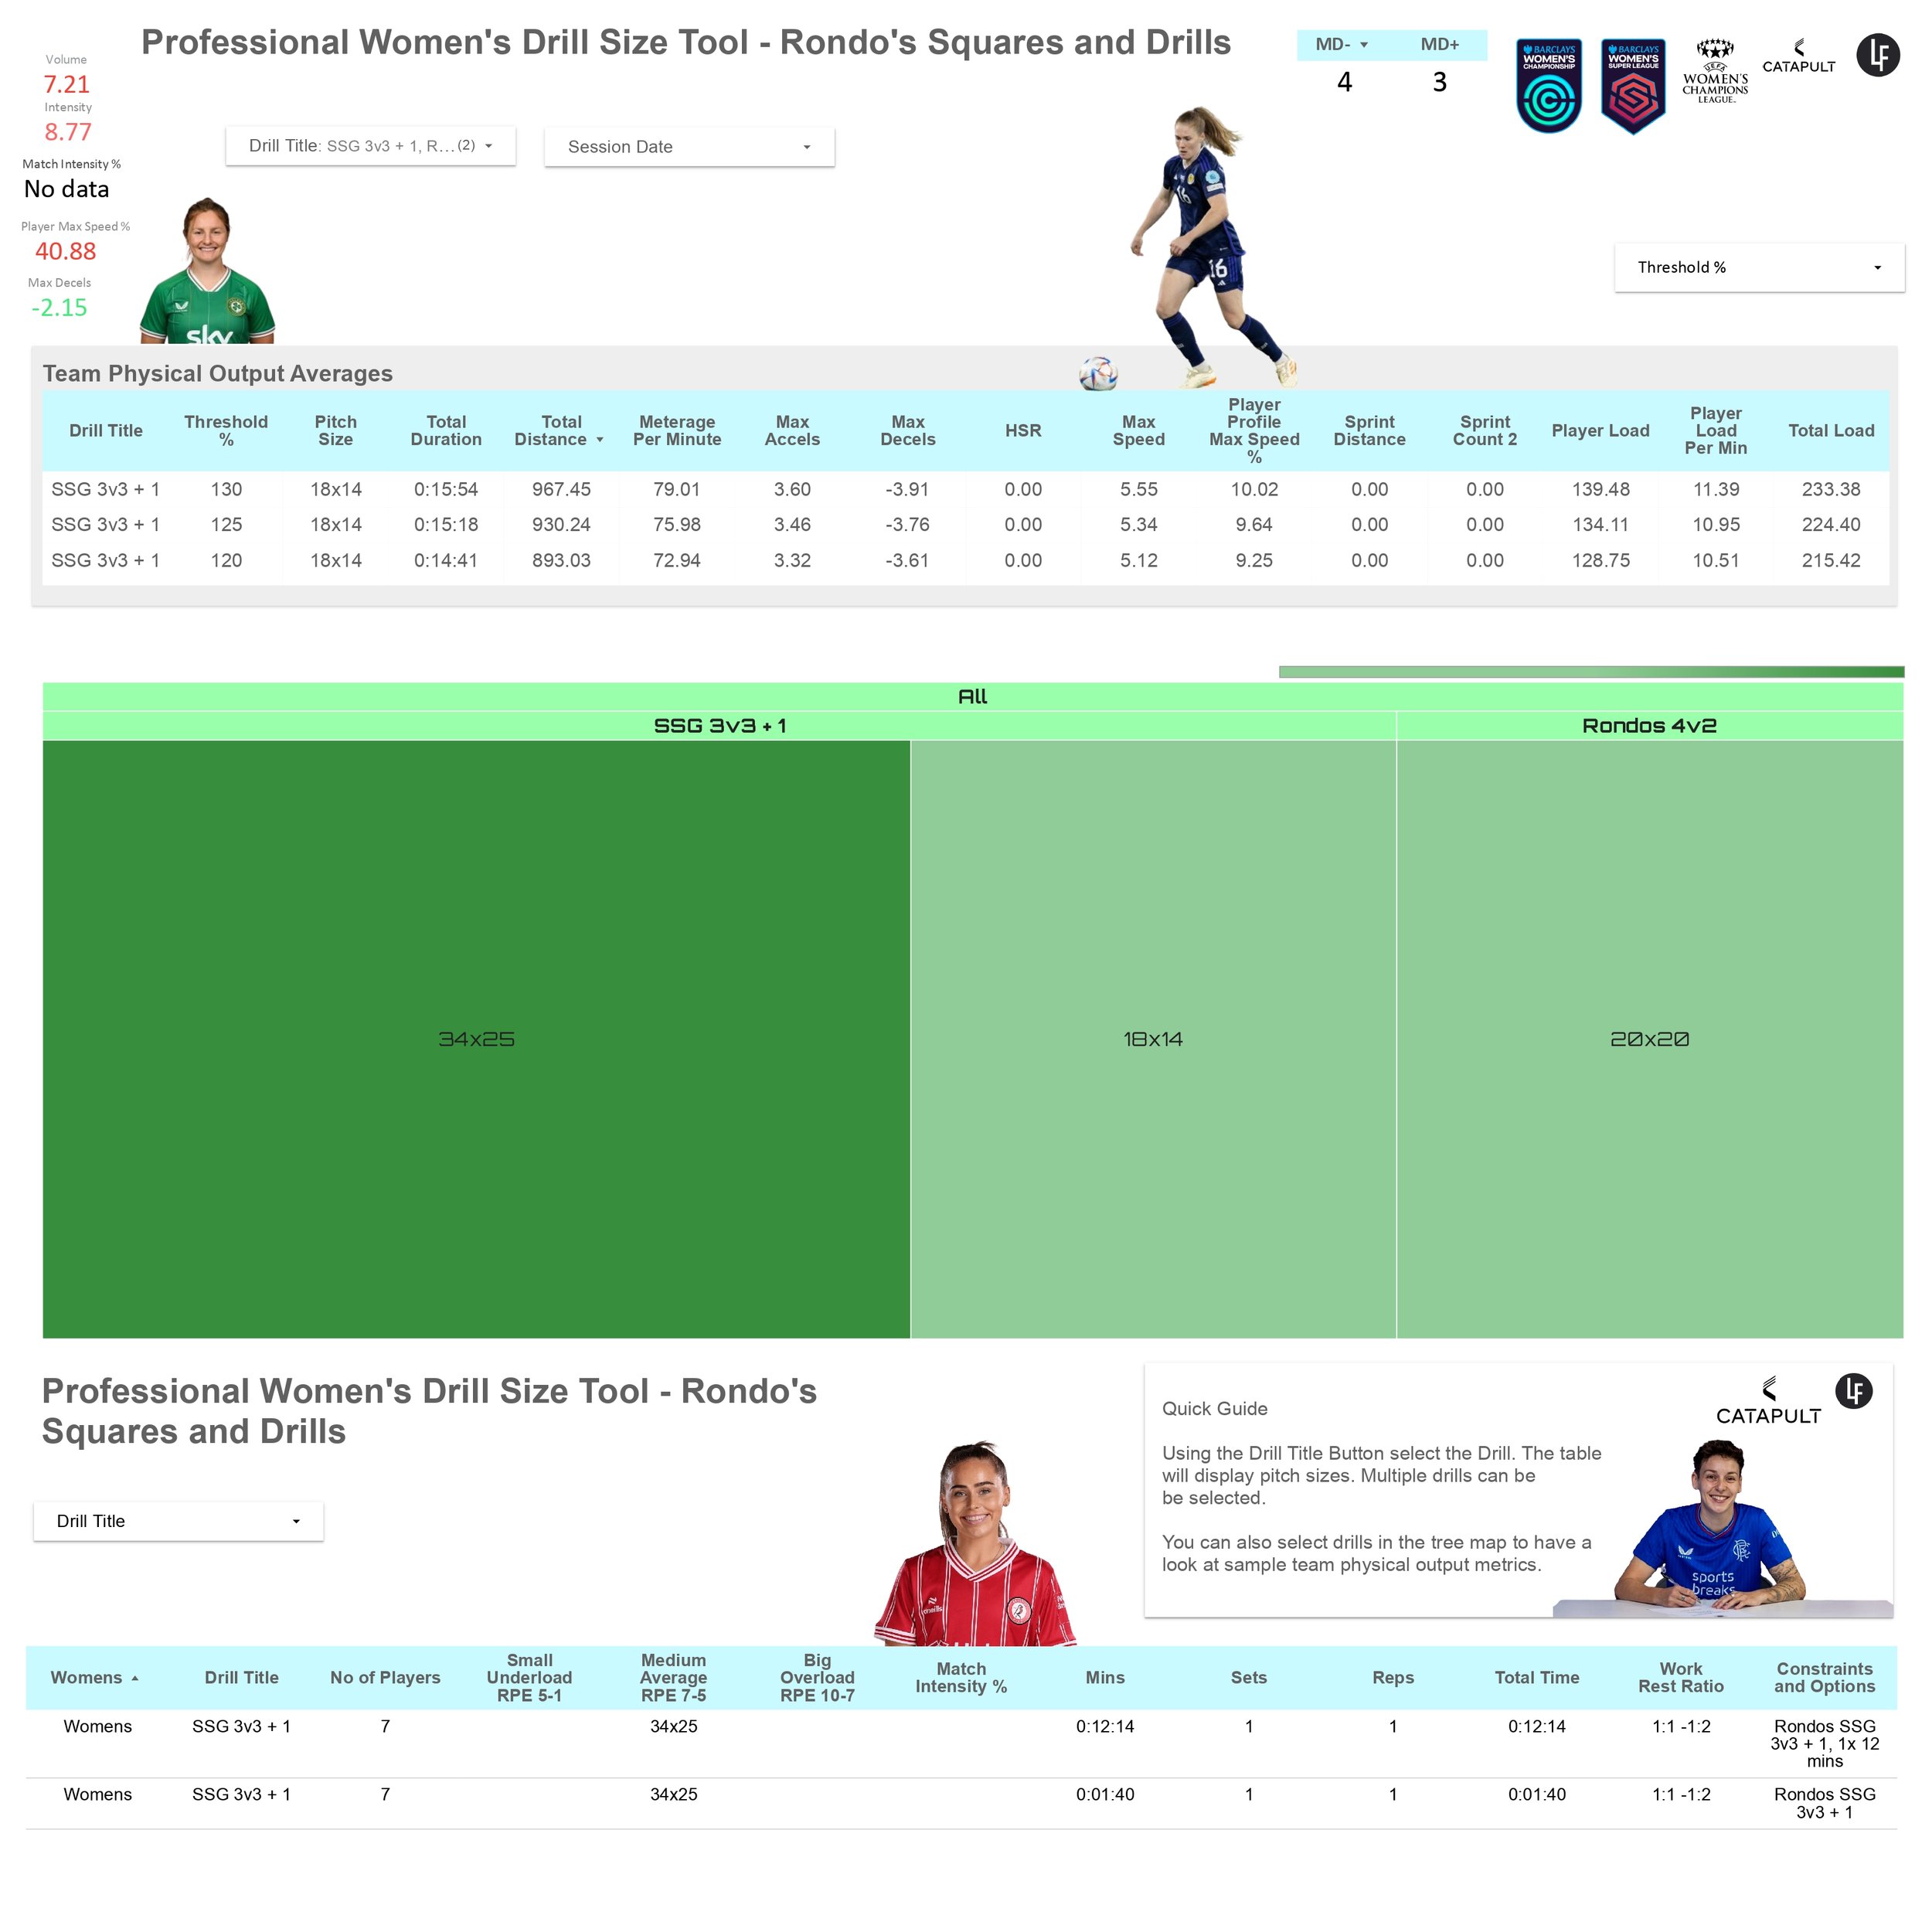
Drill percentage thresholds are taking the drill metrics at 100 percent, full drills and then using a simple formula to show drill thresholds from 10 percent up to 130 percent. I created a bigger range as some of the drills went to 120+, due to the intensity of the drills.
Return to Competition (RTC)
Using drill and match threshold percentages are great for rehab, Return to Competition (RTC) processes. I.e., A player completes 30% of a full session, this can be quantified, and the appropriate drills or parts of a session selected.
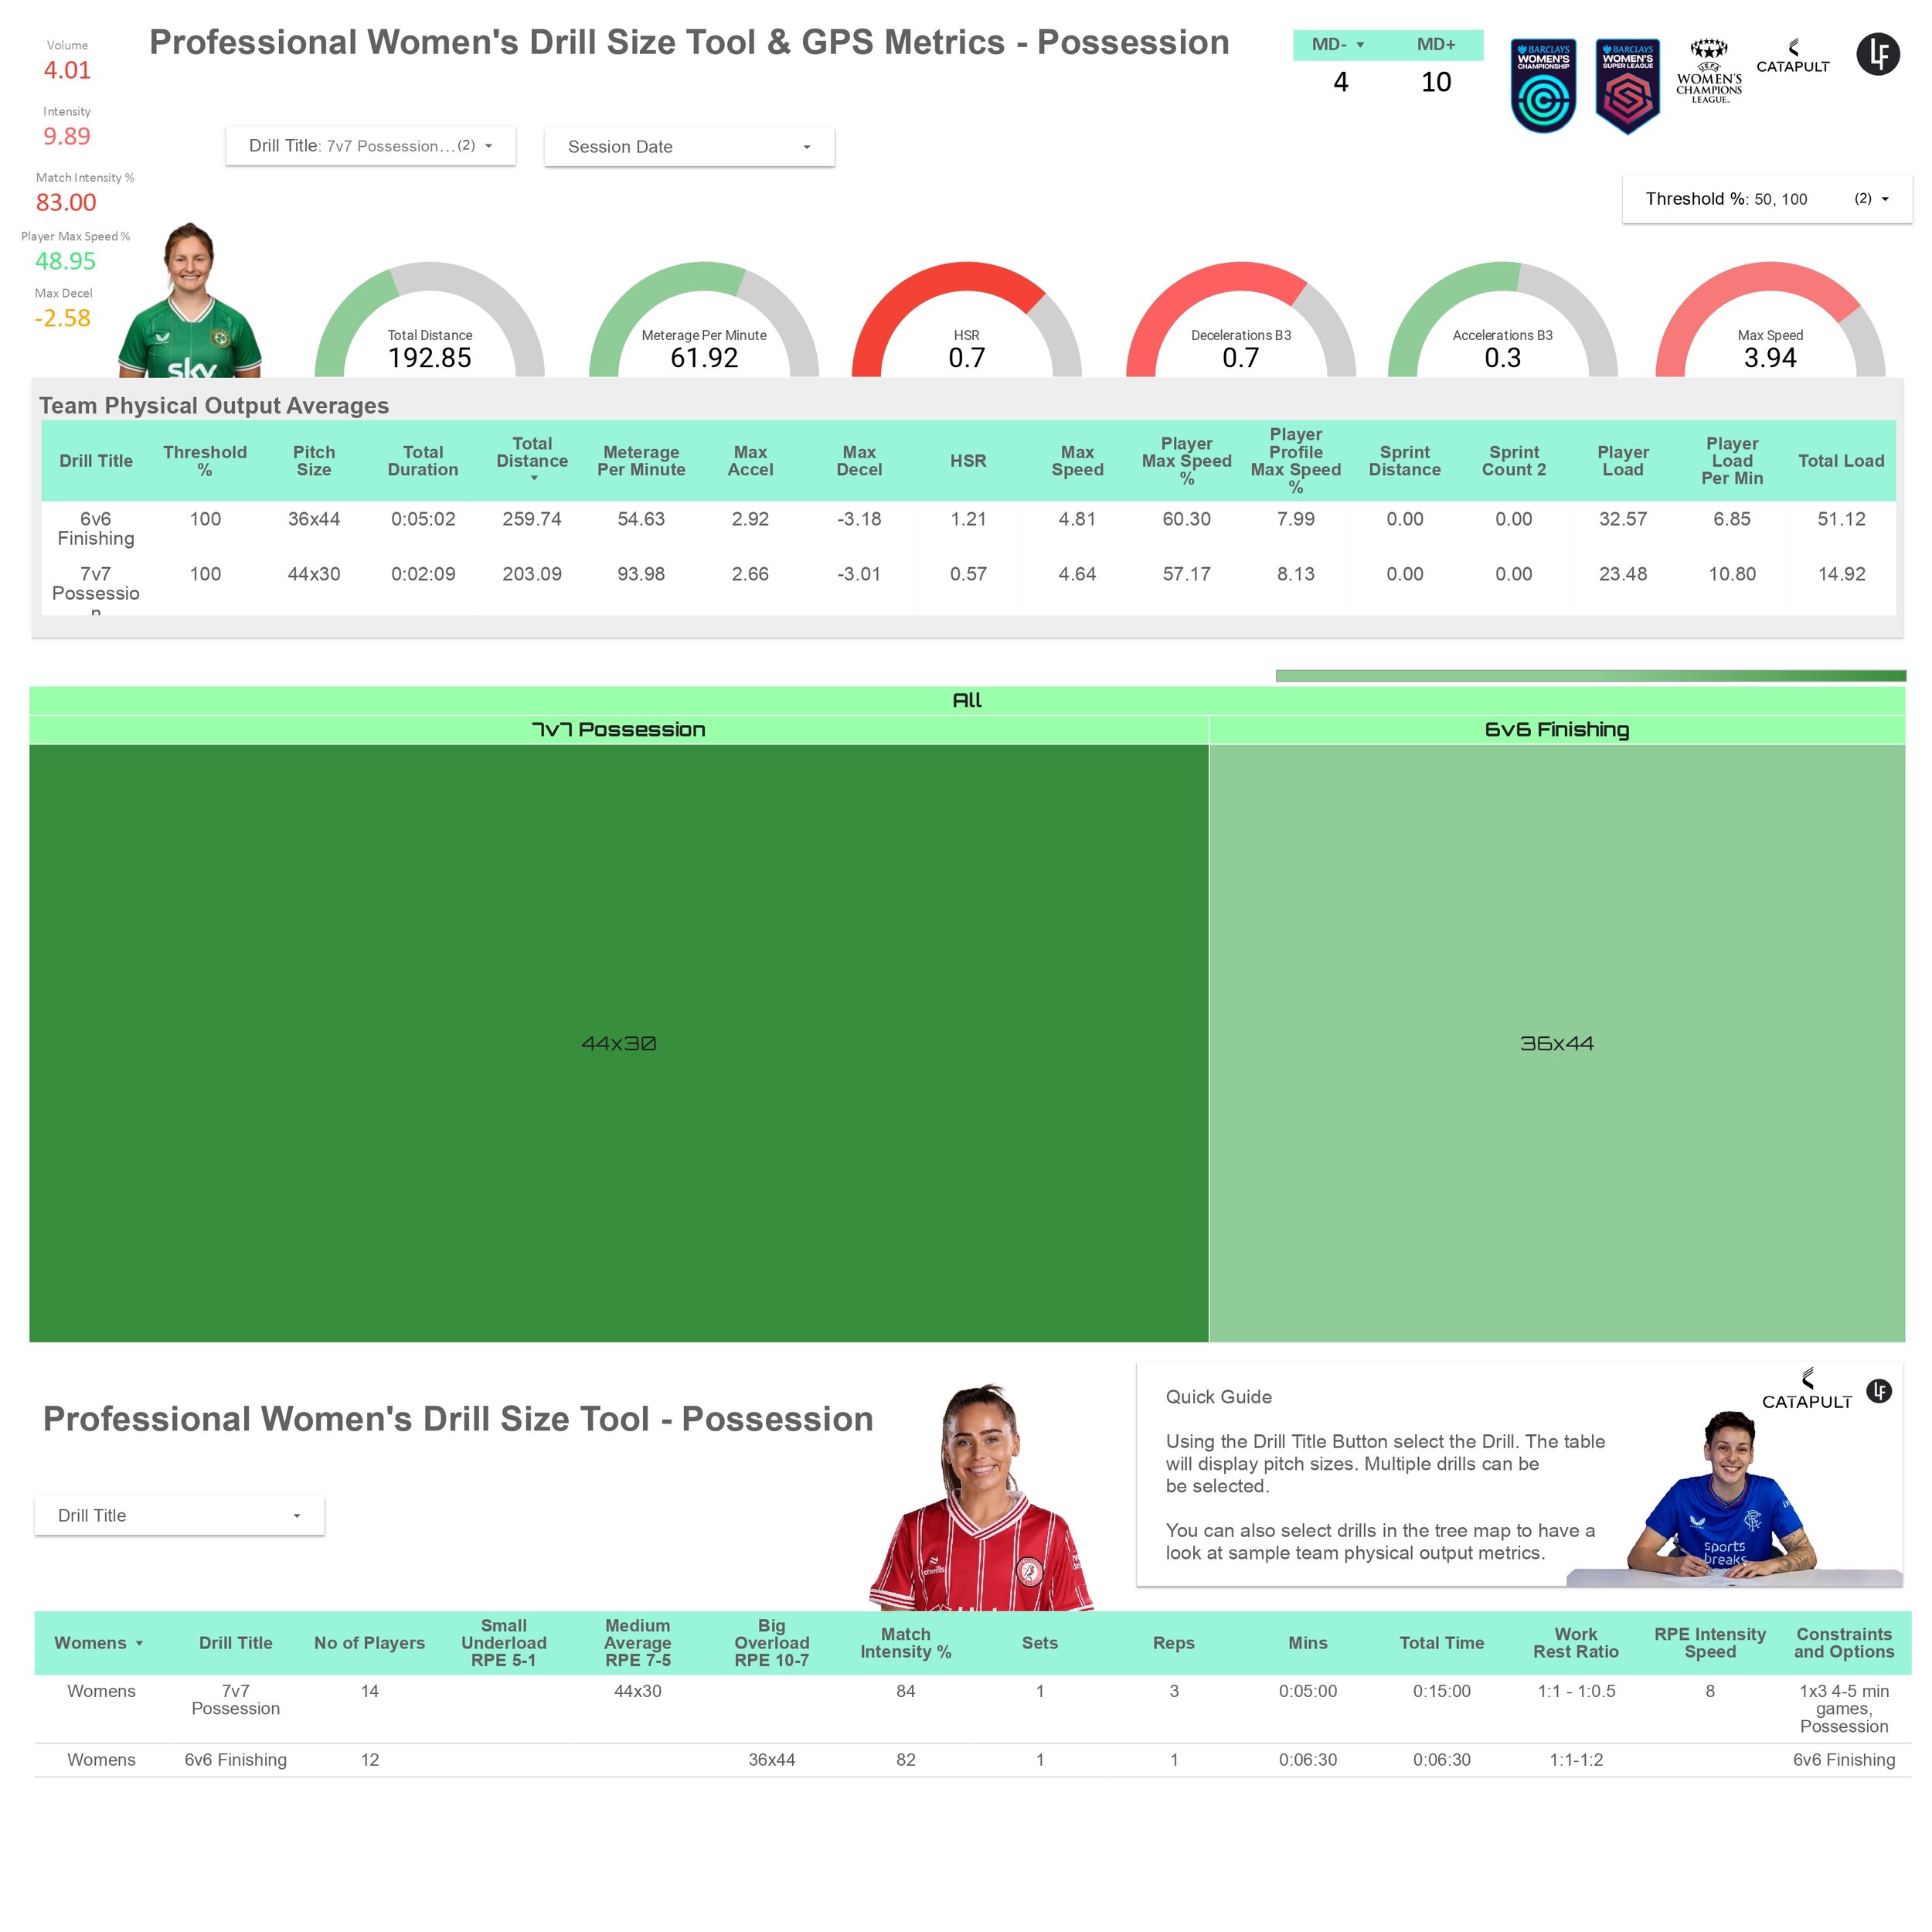
The second table (not tree map) includes example internal (RPE) and external loads, big, medium, and small overloads. Examples are for Rondo’s, squares, and possession, small, medium, and large. This also includes other session drills and 11v11 and 8v8 Internal matches. I have taken the intensity metric for each drill and compared it to match intensity, this is shown as a percentage. Match intensity changes from the first half of the season to the second half. Therefore, match intensity reflects these changes. A separate team selection tool, match data with reports will be available on my blog and socials later. This will include home and away match metric opposition comparisons, and first and second half of the season intensity and other metrics.
All training sessions can be split into a total number of minutes, and percentage of total time over the weeks and months. Coaches will then have a training overview of how much time is spent in each training drill category. For example, Rondo’s, Squares, Big Possession, Small Possession. This can also be broken down into Low Duration, Medium Duration and High Duration.
This Dashboard is live so it can be constantly updated and modified. I hope you will find this tool useful. Looker Studio looks great on mobile, so access for coaches and players on the go is easy. Looker can integrate into most programmes.
This Looker dashboard is created using google sheets
⚽ Match Intensity = Greater than 80% shows metric in red
⚽ Match Intensity = Less than 80% shows metric in green
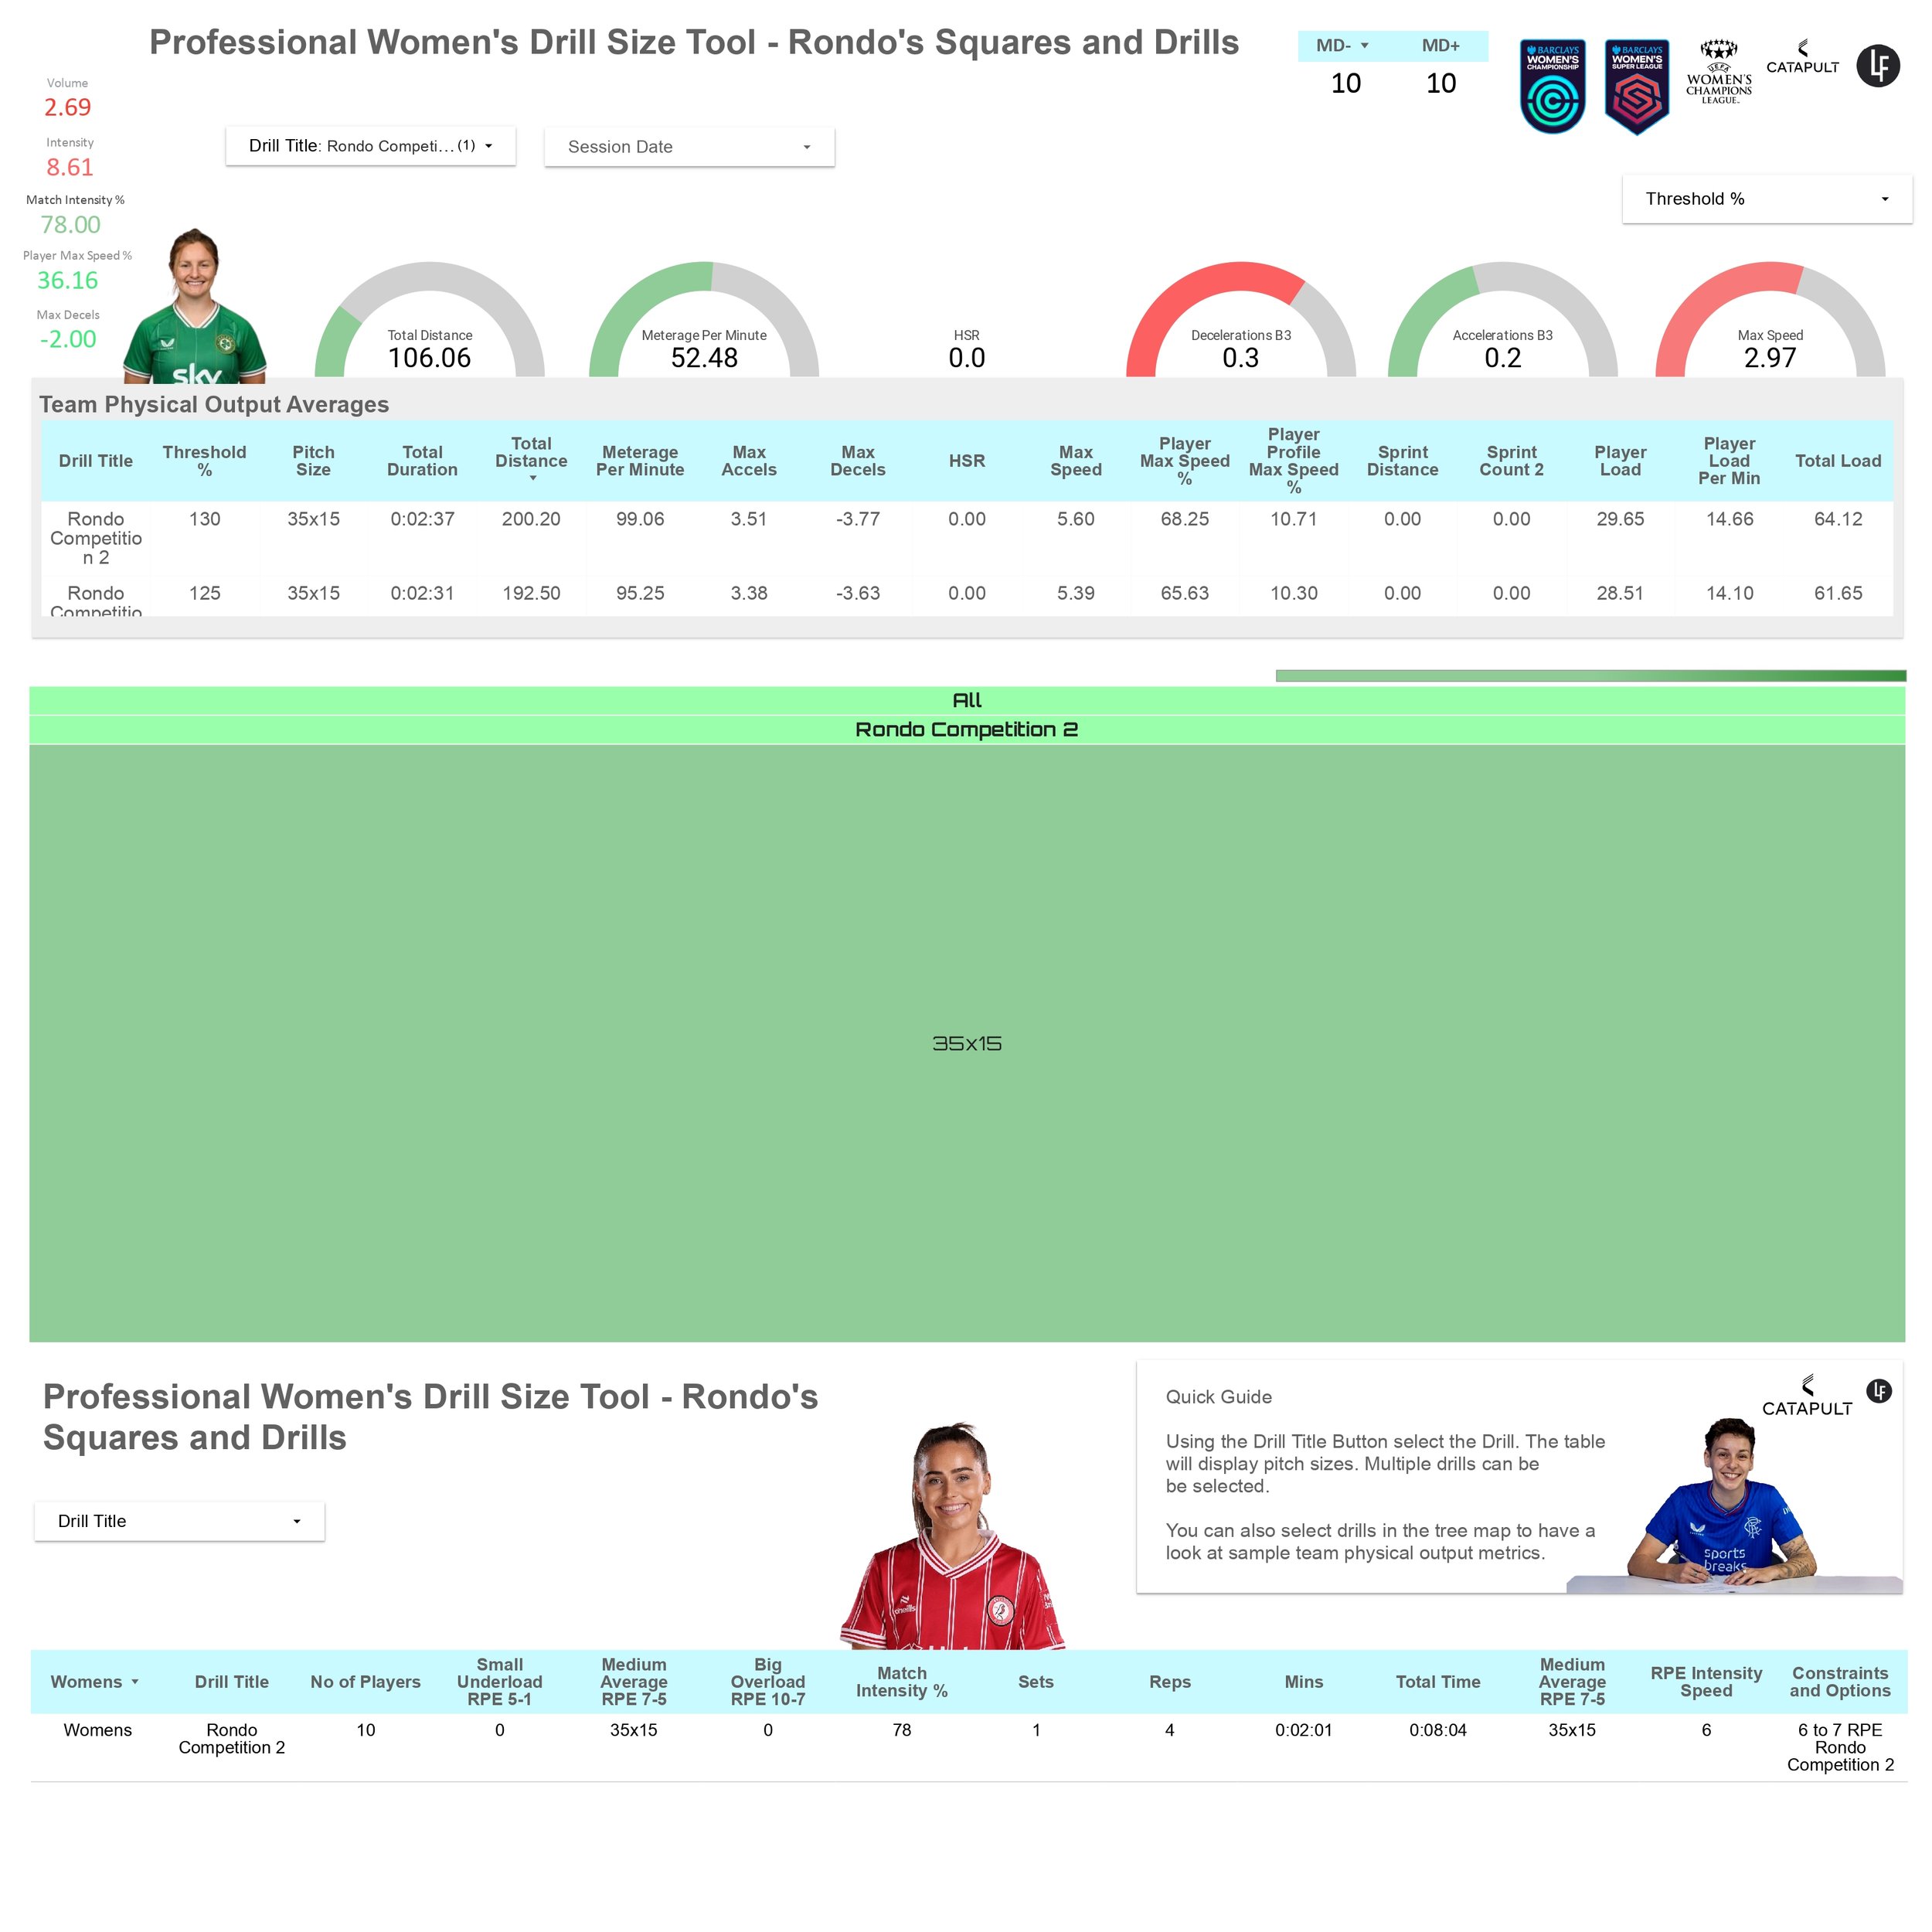
⚽ Player Max Speed % = All values greater than 89 % show metric in red
(90% Speed Threshold)
⚽ Player Max Speed % = All values less than 65 % show metric in green
⚽ Deceleration Speed % = All values greater than 4.5 show metric in red
⚽ Deceleration Speed % = All values less than 4.5 show metric in orange
Live Dashboard
Now In my Members Area ⚽
Sample PDF Report Views