Game Speed in the Highest Levels of Swedish Football
Game Speed in the Highest Levels of Swedish Football
Introduction
This is an overview of football game speed. I cover which factors are important for high speed running (HSR) and sprinting speed. What players and teams need for speed, training tips and what I use to make teams fast, or faster. You will also find videos with some slick animation from Jonas Dodoo’s Speed Works. I have also added example speed monitoring dashboards which show the speed levels you might find in the highest levels of Swedish football, Damallsvenskan (Women’s) and Allsvenskan (Men’s). For the women’s I have referred to UEFA technical reports, FIFA Women’s World Cup 2019 Physical data and other sources. I compare the speed gap between the best players in the Champions League and players in the FIFA World Cup 2019. This information I have used to improve players speed and power consistently. Importantly it is translating this onto the pitch. It’s asking questions, can players move up a gear. In the second half can players increase intensity. Do players have the speed gears to control games and pressure opponents.
Do players have power and intensity to repeat during the second half of games. Are Game changers (substitutes) able to make the most of their opportunities. Bringing energy, intensity, forward attacking play and goals when teams need it. I hope you find all the information below helpful for individual and team preparations.
Winning Teams and Performance Gaps
Other factors teams need to think about may be technical skill, substitution patterns, fitness levels and individual player fatigue. Including higher intensity runs and actions at critical moments in the game, tactics and accumulated playing time. Certain time periods are crucial phases of play, where you can either score or concede. Team and individual actions, and decisions will depend on whether you are winning or losing. In tournament football, easier routes for teams will mean less load and accumulated fatigue. However if teams have a much tougher route, then keeping players fresh, player rotation and using game changers (substitutions) is critical. In league competitions, i take the position that every game is going to be hard and only get harder towards the latter part of the season. The same factors will apply, player load, accumulated fatigue, player freshness and player rotation. Use of substitutes, injury reduction, player health and well being.
This is why when preparing teams it’s very good to have strength and depth across all positions. If one of those performance gaps is speed, or if teams have big positional gaps, i.e. between the defense, midfield and forwards, then it's important to work on the lower performing half of your squad. This is to bring them closer to the top half, by squeezing the performance gap across all positions. As the team become efficient and effective, this can improve attacking and defending together as a unit. This can also mean more attacking opportunities, pressing high up the pitch, counter pressing ’gegenpressing’ or goal scoring opportunities in the final third. Transitioning and rest defence ‘Restverteidigung’. Even the smallest of margins across all positions can make a difference. It’s not just about high speed runs or sprinting. Coordination and brain to limb connections improve with speed and power. This means limb speed improves and becomes more efficient. If you have players and sprinting speed is not their game. This may mean timing improves in 1v1’s, tackling, ball distribution, the ability to kick the ball with precision to players who do have the sprinting speed. Movement and change of direction skills improve. Efficiency, intensity and speed increases in small areas on the ball and off. If you do have these type of players It does not mean speed is fixed, you just have to find what they need and provide the solutions. They may have other very effective and powerful parts of their game. With a quality solution focused programme, It may be the case that over time they improve their sprinting speed regardless.
Speed and Muscle Forces
Training to optimize your speed or velocity profile means focusing on Speed, this may look like 3 Speed, 2 power-speed and 1 power. Strengthening the most important muscles needed for high speed running and sprinting means the application of more force to produce explosive power.
Video 1
Ankle and calf training are really important for overall speed. Feet are the first point of contact with the ground. The harder you can apply force through the ground, means more vertical support to move forwards. Speeds over 7m/s switch to different muscle regions. Calf muscles also have an important role in protecting joints further on up the kinetic chain, I.e knee joint, hips and pelvis. Calf muscles are big stabilisers and are also involved in knee extension.
Hamstrings do not work in isolation, the graphic and Video 2 shows muscles for sprinting, moving up the kinetic chain from the soleus and gastrocnemius (calf muscles) and tibialis anterior (shins), to hips, hamstrings and glutes.
Video 1
Video 2
Videos - Created by Jonas Dodoo - Speed Works 2021

Looking after your tendons and connective tissue is also crucial. You can see more on my blog, under Tendinopathy Strategies - The Brain, Sport Performance and Injury
Hamstring strength is crucial for horizontal force production. A strength deficit or imbalance can predispose athletes to muscle injuries. Hamstring muscles act as a hip extensor and knee flexor. The speed in which you move means that to increase speed, hip flexion must increase. For example Dorn et al (2012) found the ILPSO, HAMS and GMAX - contributed to greater hip and knee accelerations as running speed increased at higher speeds between 7m/s 25.2kph and 9.0 m/s. 32.4/kph
Peak forces of the GMAX & HAMS doubled during the terminal swing, or when the foot is no longer in contact with the ground and free leg is recovering forward, ready for touch down. (McMillan) Wiemann & Tidow (1995) found that hamstrings were most active during the sprinting gait cycle. Ito et al (1993) analysed data from the 100m final at the world championships in Tokyo. By comparing Carl Lewis, Leroy Burrell and slower sprinters they found that world class sprinters can pull their leg through the back. I.e get the leg through and down as fast as possible.
Edouard et al (2015) also reported that eccentric muscle activity of the late part in the swing phase linked with horizontal force production for sprinting. For speed and power, high hamstring strength and activation at the end of the swing phase is needed. Force applied by muscles are transmitted to all the body segments simultaneously. Zajac and Gordon (1989).


Conditioning Snap Shots
Extensive and Intensive tempo work, for me has been a effective tool getting players fit and fast. This compliments the main possession work on the pitch. We can train immediate energy systems, and longer duration’s. Team athletes need the ability to maintain power between bouts or keep power variations low. Using a variety of different intensities is much better than hard most of or all of the time.
If you have sessions in which athletes do not have appropriate recovery, then the only way to get through the session Is to turn the power down. So if you have sessions that demand 80-90 % HRmax or maximal exertion, if athletes don’t get the appropriate rest and too much volume, then fatigue starts to accumulate and performance drops. Instead of training in a high intensity zone, athletes end up in the middle, no-mans land, not enough for adaptations in performance nor low enough to stimulate recovery/regeneration. Athletes find that the only way to get through the session is to turn the power down, or the session ends up with athletes in survival mode, doing the minimum to get through it with no technical quality. How do we keep athletes fresh and fit and recovered for the next training session/week/month. We still need to get enough work in but not as simple as it seems.
Using high low system means, base training is the foundation, with high intensity work dropped in on high days or, interspersed throughout the week. So when players go high, they can really push it to the max. Maximal training can also detect drops in performance. High intensity should not be the mainstay of the programme, if we want fast powerful players. I find that tempo work is a safe way to condition players, and the ability to recover from high intensity work. Players should feel they have worked up a sweat, but it should not be fatiguing. This builds up engine capacities without negative effects on speed and power. Its gets blood flowing to your muscles and increases engine capacity for high intensity work. Tempo training increases the capacity of heart chamber to accommodate blood. Heart becomes more efficient for work. If you have lots of players who are injured, have niggles or are unknowns, tempo work is a great method to use. If you wish to add more speed gears, or increase players speed reserve this one the way to do it.
Example Session: Sections can be used. Also can be used for match replacement
Set 1: 5X Full Pitch Runs – Run around the full pitch. Run 72 seconds for each lap (4.4m/s) 16km
(Rest 2 minutes between reps) Active Recovery walking /easy ball work
Total Distance 1600m
Complete the Following
Set 1: 8 X 50m, 60 sec Rolling Clock after each rep, then(3 Mins Set Rest) Run 50m in 11 seconds (4.5m/s) 16.2km
Set 2: 8 X 70m – edge of 18yd box. 60 sec Rolling Clock after each rep, then (3 Mins Set Rest) - Run 70m in 15-16 seconds (4.6m/s) 16.5km
Set 3: 6 x 100m 60 sec Rolling Clock after each rep Run 100m in 18 seconds (5.5m/s) – 19.8km
Total Running Set 1 400m + Set 2 560m + Set 3 600m
Rest 3 Minutes Between sets - Active Recovery Walking/Easy ball work
Total Distance: 1560m
Up and Down Work
Set 1: 8x 40m Up / 40m Down 14 - 15 sec work (14-15 sec rep rest)
Run 40m up, and 40m down (80m) in 14-15 secs (5.3m/s) – 19.1km
Active Recovery Walking / easy ball work
Total Distance 640m
Total Session Running Distance 3800m / 3.8K
Example: Extensive Tempo Intervals
Park/field/pitch length is run at 70-75% optimal speed, park/field/pitch width is either walked, body weight exercises completed or your football skills
Total Distance 3300m (2500m without width distance)
Set 1: 100+200+100+100 (Walk the width after each length or complete body weight exercises for all sets for tempo 1 and 2)
Set 2: 100+ Walk the width +200 Walk the width +300 Walk the width +100 Walk the width
Set 3: 100+ Walk the width 300+ Walk the width 300+ Walk the width +100 Walk the width
Set 4: 100+ Walk the width 100+Walk the width 200+ walk the width +100 Walk the width
Heart rate should be no more than 150 bpm average or 70/75% of max heart rate to ensure low intensity. If heart rate increases, slow down. If your heart rate goes above 150bpm on starting exercise, then try and keep it below 170bpm. Your heart rate will become lower as you get fitter and the ability to control your heart rate will improve. If you cannot reach 150bpm, then your range is between 130bpm-150bpm.
Sustaining Speed, Critical Periods During the Season
Here I have added to the Insights by Leventer et al 2018 exploring intra-seasonal variation of injury patterns among German Bundesliga soccer players. These insights can help football teams prepare players for returning to training and competitive football. Fixture congestion presents also the highest risk to players. Doses of speed can help the performance of the team but can also offer protective affects as part of wider injury reduction strategies, to increase the capacity to reduce overuse soft tissue injury (wider strains and sprains). The latter part of the season or if a league has a mid season break, can be critical for success. League placings are decided and European success, if your team are playing UCL or Europa League football. Maintaining momentum during the season is important. Evolving to meet the demands of the game is critical, teams can quickly fall behind if they choose not to move forward.

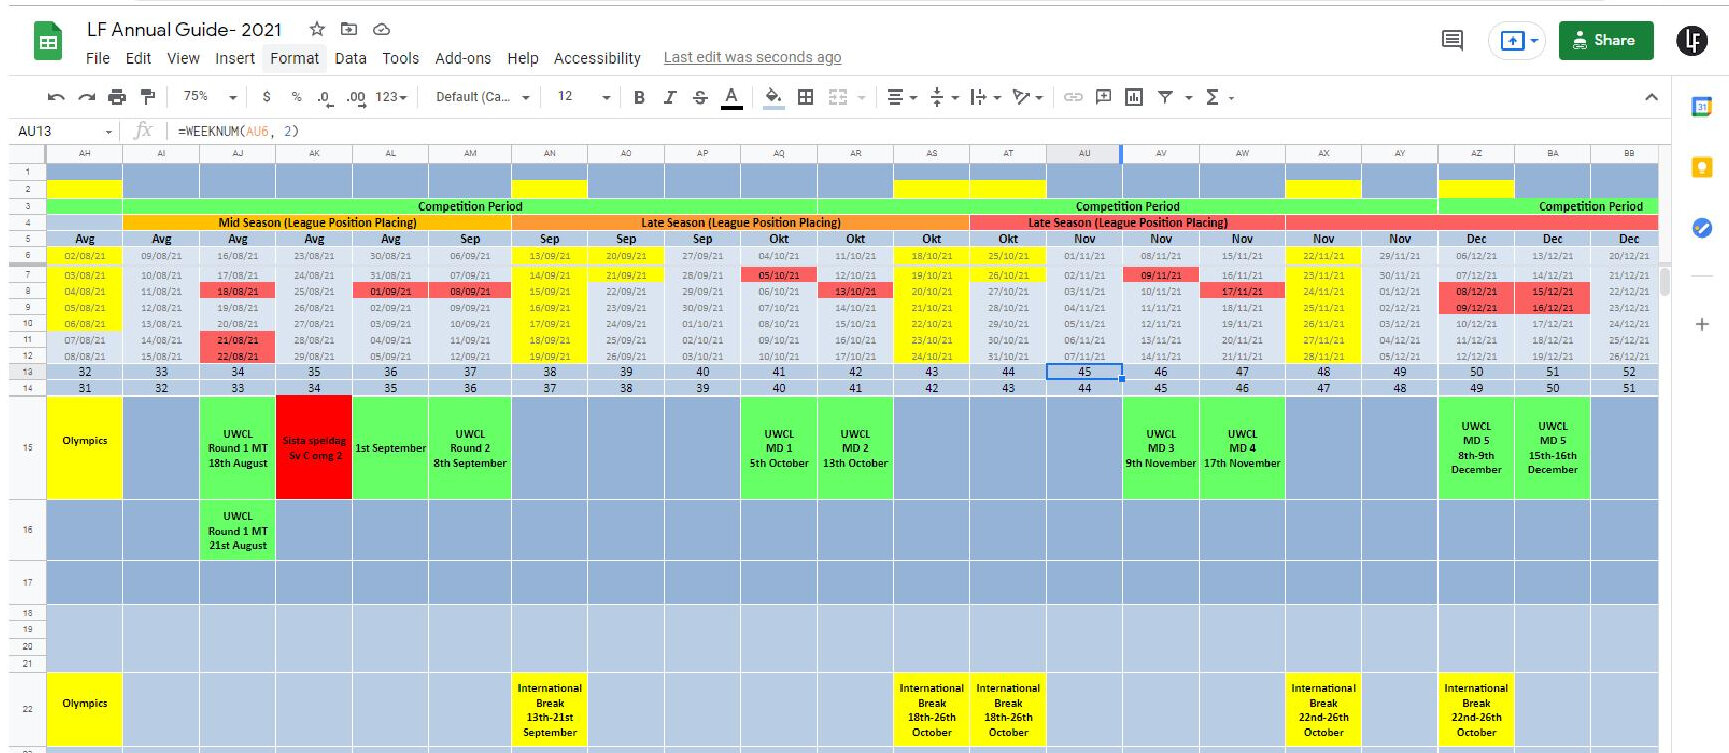
Below I have a simple traffic light system. From August onwards the team (Damallsvenskan), is moving from mid season (league position placings) in orange, to late season league placings in darker orange. October is a crucial phase where everyone in the league are really fighting and slugging it out for those final league positions. This period can determine whether you are in a position to win the league, or are in a spot for lucrative Champions League football. This can be transformative for clubs.
Strength
A base level of strength, in particular single leg strength is critical for players to be able to withstand tackles and physical challenges. Players need to be prepared for the physicality of the league they play in, and be robust enough to cope with density and frequency. Lower leg strength will reduce the cost of change of direction, braking, 1v1’s, pressing, and up and down work on the pitch. Strength will reduce the cost of high speed running (HSR), sprinting and change of direction (COD).
Decels and Accels
For change of direction on the pitch. Dalen et al (2016) found players regulate speed according to the deceleration loads they can tolerate. Although high-intensity decelerations have been shown to be very short in duration (72% less than 1 s duration) by Bloomfield et al (2016), they comprise the highest magnitude of mechanical load, per metre—reportedly up to 65% greater than any other match-play activity, and around 37% more than similarly intense accelerations. Even in elite players, this load places a significant demand on the ability to repeatedly dissipate high eccentric braking forces. The cumulative effect following match play is associated with markers of exercise-induced muscle damage, i.e. muscle soreness. Russell et al (2016) and Varley et al (2017)
The muscle damage resulting from repeated intense decelerations is caused by strain to muscle fibres during eccentric (lengthening) contractions that result in disruption to the integrity of muscle. Tierney et al (2016) found positional movement demands, formations and tactical changes affected the number of decelerations. Wide midfielders performed 20% more high-intensity decelerations when playing in a 3–4–3 (n = 66) compared to a 4–4–2 (n = 53) formation. It is important to include these considerations when designing training and rehabilitation programmes. Causes in decline in performance will determine recovery strategies for players after games and training. The basics of eat, sleep and quality rest are important.
Individual player differences determine deceleration strategies and loading. Self-organistion of limbs, mean some players will sit deep and use their glutes, chopping steps. Others will have straighter legs, hips may be higher and the trunk angle may be taller. Players with a lower strength ratio, may have a straighter leg, than players with higher eccentric strength, who may find decelerating and change of direction easier.
Trunk
Upper body Strength should not be underestimated, this is also critical for high speed running and sprinting up and down the pitch. The shoulder complex is an important part of power development. Upper body work assists with intimidating opponents. Physicality and athleticism can send a message out to opponents that they are in for a long hard battle. Power perceived is power achieved. Core muscles illacus and psoas are critical for mid section stabilisation, for example leg switching when sprinting, kicking and for change of direction. If you add more speed to players, then you really have to work on control and stabilisation as more force is applied.


WSL, Damallsvenskan, NWSL v UEFA Champions League
Speed can also improve performances at European level, excellent repeatable speed and power requirements and explosive actions are required at the highest level. Repeatable speed or speed endurance means, if a player fails to recover after a sprint when attacking, it may lead to a delay in reassuming a tactical defensive position, thereby leaving a team vulnerable defensively (Bangsbo 2003). Evidence show that sprints precede goals. This interactive dashboard shows league data thresholds / metrics for the Women’s Super League (WSL), Damallsvenskan, this is the highest level of Swedish Women’s football, the National Women’s Soccer League in the USA (NWSL), Women’s Champions League (UWCL) and Women’s England Team fixtures.
Interactive Dashboards
You can click and explore the two page report by using the league and Country button, you can compare multiple leagues across all metrics.
Scroll down to the bottom right hand side of the dashboard (Google Data Studio) and go to full screen for the best interactive experience. You can also just explore the dashboard in the blog
GPS Bites
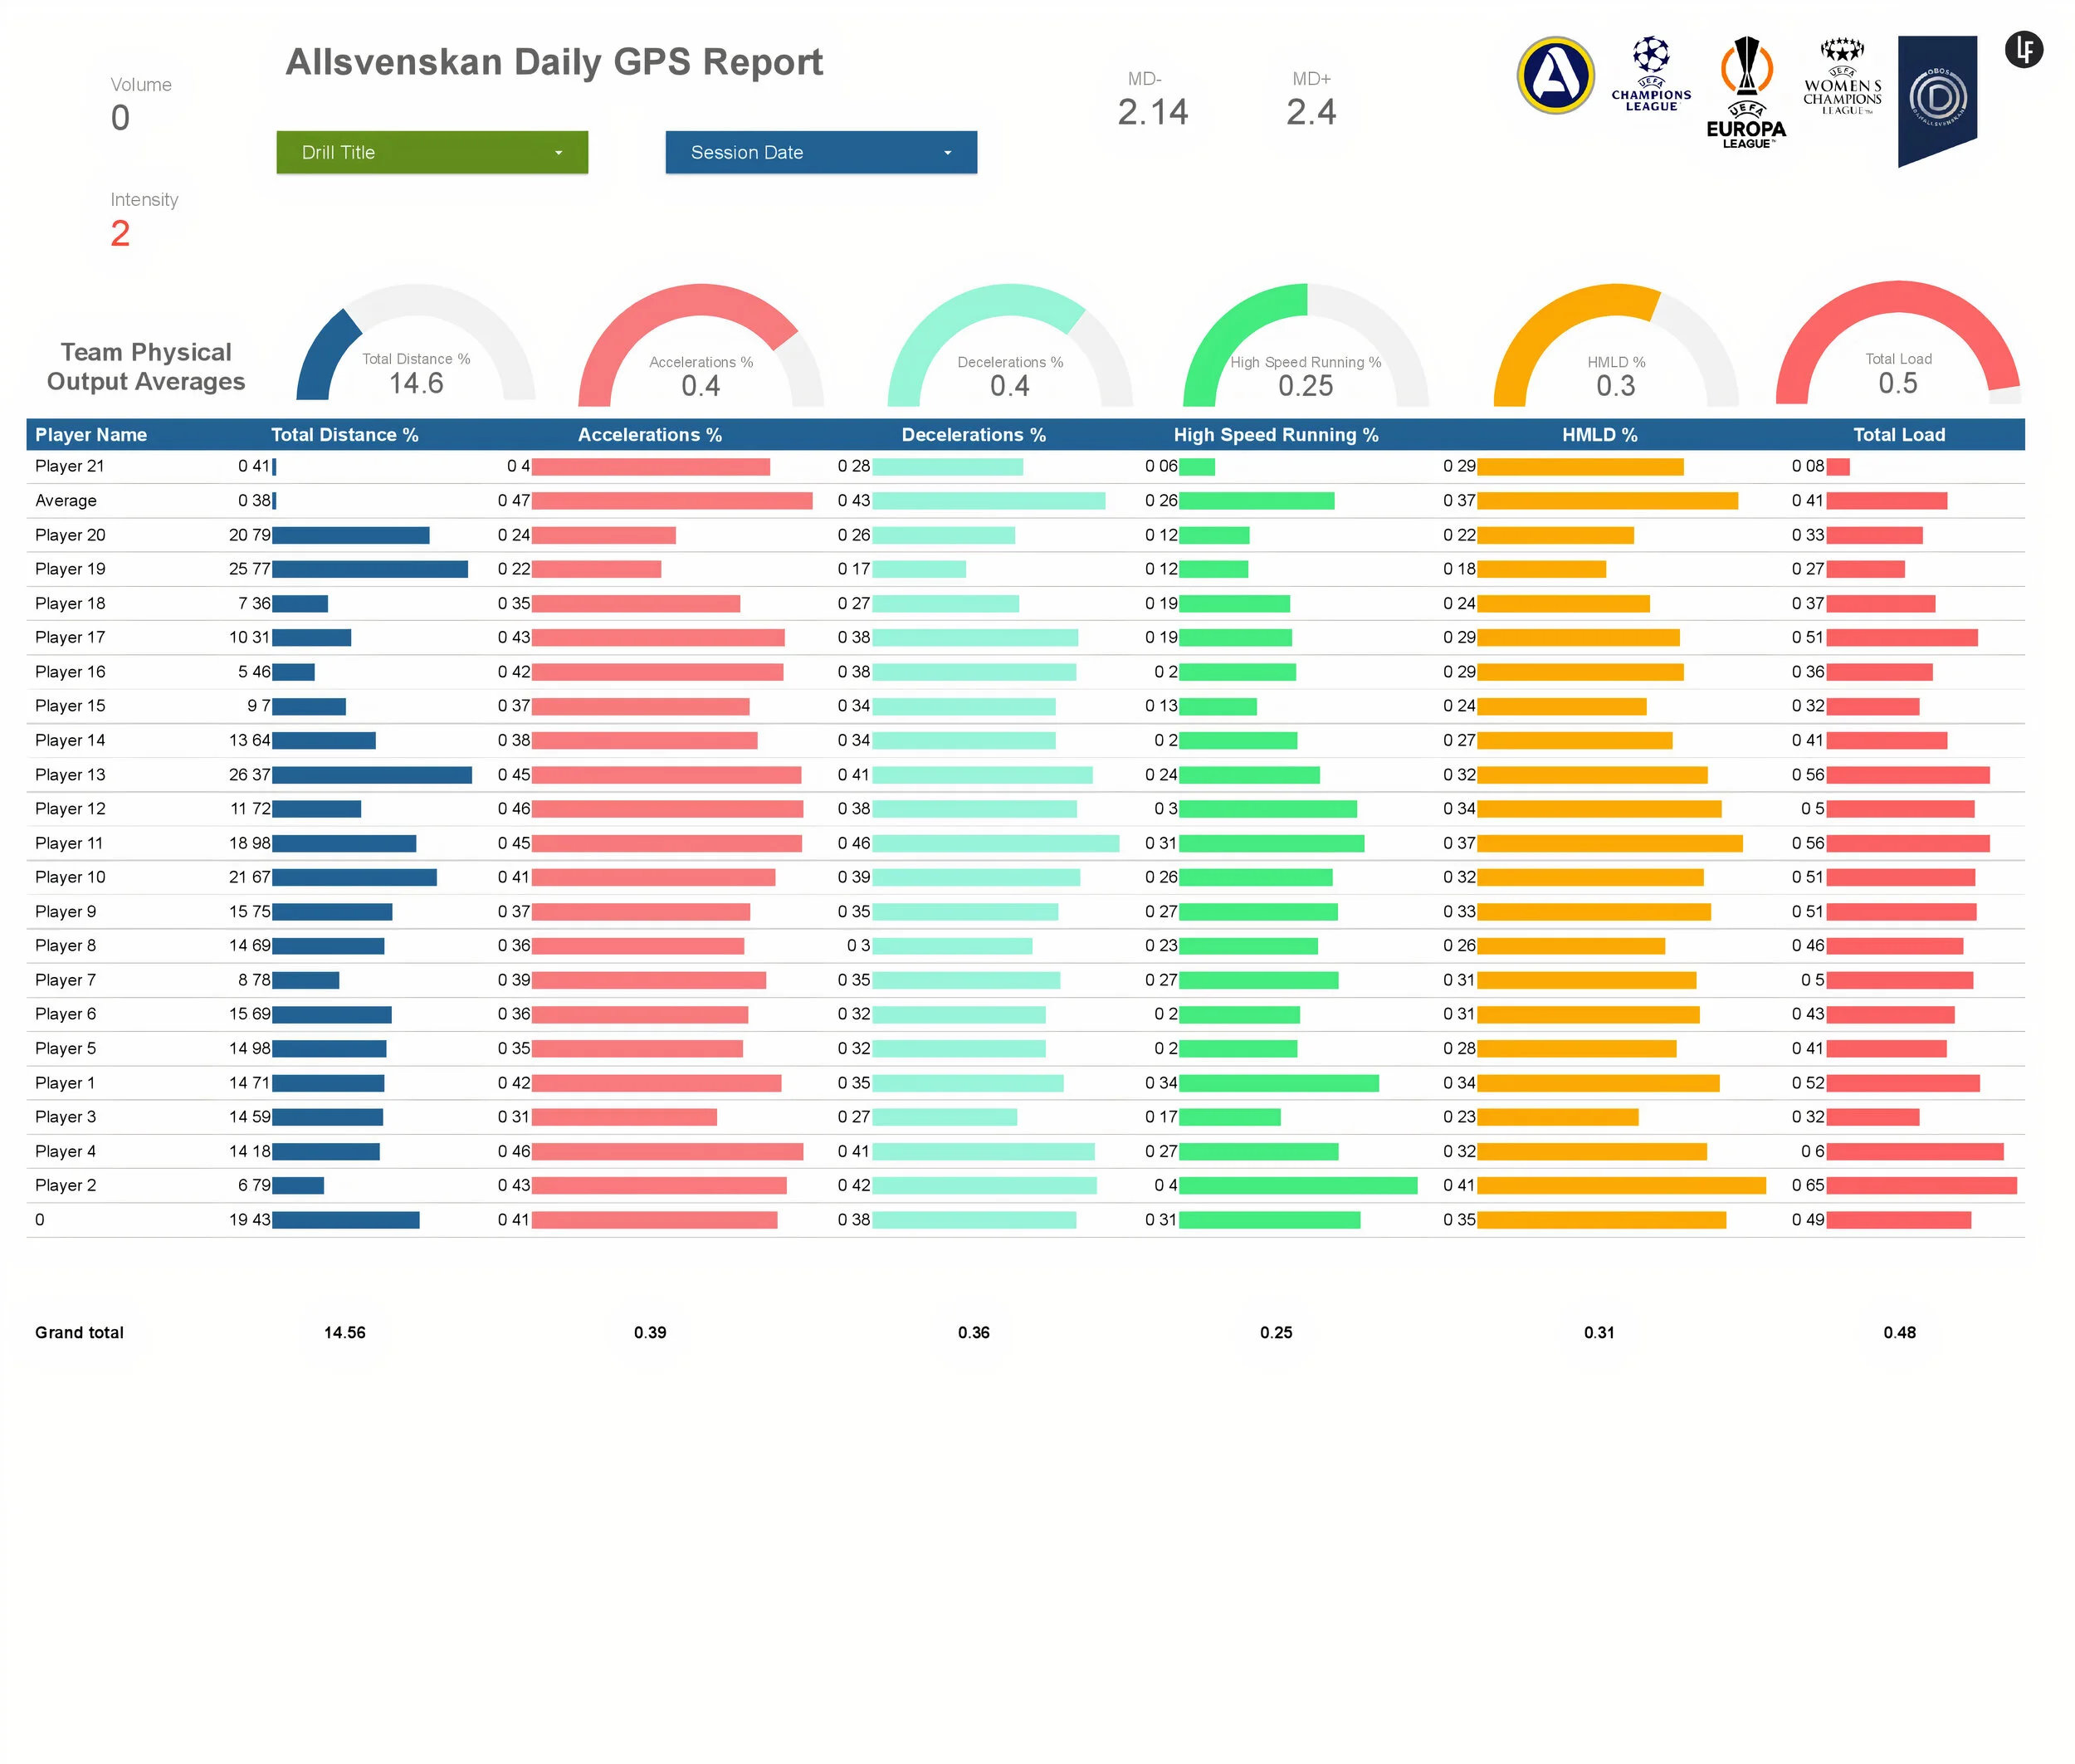
GPS and Internal monitoring can provide Insights to help athletes and coaches make Informed decisions to Improve performance. This can give coaches a frame work to support training and competition, and assist tactical and technical analysis, and managing physical levels and psychological stress. We can look at data variability and variability between players. We can adjust training to level up players who need it or reduce for those that do not. We can look at time above maximum heart rates i.e 90%, we can overload players or manipulate load to develop players.

WSL, Damallsvenskan, NWSL
v UEFA Champions League Game Speed
Scroll to the bottom of the blog to explore the interactive Dashboard which is live.
This 7 page interactive dashboard compares top players from teams in the Uefa Women’s Champions League (UWCL) and the Damallsvenskan using Women’s World Cup Speed Thresholds 2019 and UEFA Technical Reports 2020. This dashboard breaks down positional speed as well as team game speed. Scroll down to the bottom right hand side of the report (Google Data Studio) and go to full screen for the best interactive experience, or you can explore in Google Data Studio. (Reilly and B Thomas, 1976) reported that the fastest players are on average ahead of the slowest ones after 10m of a sprint. Football has evolved and the speed gap has got bigger, players can be 2m ahead on average ahead of the slowest players. We know speed is not the only factor to determine on pitch success, but it can certainly assist teams.
Page 1 Position: Anfallare Forwards
The first graph shows weekly sprint data over 30m for forwards, by using the session date button, you can also select a specific date which will then bring up the relevant week. By selecting multiple weeks / dates, you can view comparisons. You can hover over the graphs which will show maximum speed, metres per second (m/s) and kilometres per hour (km/h). Forward team averages are displayed on the right side of the graph. The surface button automatically filters to show either contra/3G or grass. You can also select by surface.

Damallsvenskan Anfallare & UWCL Speed Gap
The second graph shows the speed gap between Damallsvenskan forwards, and top forwards from teams in the Women’s Champions League 2020. For example, the speed gap shows coaches how far a Damallsvenskan forward is behind Asisat Oshoala on the pitch in a 1v1 situation over 30m. Forwards in the Women’s Champions League are on average sprinting at above 8 metres per sec to 10 metres per sec plus. Match data from Damallsvenskan show individual player max speeds ranging from a minimum of 7.3 metres per second up to 10 metres per second plus.
The third graph shows individual Damallsvenskan forwards maximum speed, metres per second (m/s) and kilometres per hour (km/h) and speed zones in comparison to the fastest UWCL forwards.
Page 2 Position: Mittältare Midfielders
The first graph shows weekly sprint data over 30m for midfielders, team averages are shown on the right side of the graph. The second graph i have auto set with filters. This shows sprint data versus the best midfielders from teams in the Women’s Champions League. Go to session date and select the dates you would like to see, Damallsvenskan speed averages will change according to the dates. If you select multiple dates, for example two dates, 2 different weeks will appear on the graph, i.e. week 17 and week 19. The averages of both weeks will be displayed on the right hand side.
Damallsvenskan Mittältare & UWCL Speed Gap - Shape and Formation Changes
The second graph shows the speed gap between Damallsvenskan midfielders, and top forwards and defenders from teams in the Women’s Champions League 2020. Due to a lack of UCL Midfield data, this still can give you a picture of the speed gap. For example, the speed gap shows coaches how far a Damallsvenskan midfielder is behind Nadia Nadim on the pitch over 30m. If a manager and coaches need information to select a match day squad. This data can be used to compare all the midfielders, and which midfielders are best suited to play. More importantly do they have the capacity, can they flex with formations or shape changes throughout the game. Shapes and formations and Percentage (%) of time played in these formations or shapes, with the physical data, can then be compared against win or loss ratios. In essence, is the team winning consistently with these midfielders on the pitch. Nadia Nadim in comparison to Damallsvenskan midfielder 9, is 1.93 metres ahead. By selecting the player name button you can compare UCL players and Damallsvenskan midfielders, or any other position you wish to look at.
The Third graph shows individual Damallsvenskan midfielders maximum speed, metres per second (m/s) and kilometres per hour (km/h) and speed zones in comparison to the fastest UWCL forwards and defenders. I have put a UCL average above the graph. Metres Per Sec over 30m 8.24, Kilometres Per Hour (Km/h) over 30m 29.67 and the Speed Zone 1-5 is 5 30m. England Team Benchmarks are above the 2nd graph, these are in metres per second.

Page 3 Position: Försvarare Defenders
Just the same as the forward and midfield data, the 1st graph shows weekly speed. This time for graphs 2 and 3 i have a small data sample, UCL data defenders Ashley Lawerence from Paris Saint-Germain Féminines (PSG) and Alia Guagini from Atlético Madrid. The 2nd graph shows the speed gap and how many metres behind Damallsvenskan defenders are on the pitch. The fastest Damallsvenskan defender ranges are from 4.61 to 4.45 over 30m, team averages 4.51, 6.66 metres per sec (m/s) 24km/h). The speed gap 1.5 metres v the fastest Damallsvenskan defender. Match speeds range from 7.8 to 8 metres per second towards the latter part of the 1st half of the season. This Match data is from separate data, i will create another blog post around GPS data in Swedish football, Men’s and Women’s.
Champions League Intensity and Demands
The aim is for players to continue to increase match speed as the season goes on into the second half after the mid-season break. This means intensity capabilities increase ready for the challenges of final league placings, and in addition if teams are playing Champions League football. Intensity and demands will be 2x higher on average than the league, and for some players/teams new to UCL this will be even higher.

Speed Monitoring
Page 4 Position: Försvarare Defenders,Mittältare Midfielders and Anfallare Forwards
All positions are displayed on the same page, starting at the back with defenders, midfielders and then forwards. This page displays individual maximal speeds over 30m, Metres Per Sec, Kilometres Per Hour (Km/h) and the Speed Zone 1-5. Team positional averages are displayed on the right hand side of the 3 graphs.

Legs, Lungs, Speed and Brains
Speed monitoring can inform coaches about the freshness of the team and individuals. For example accumulated fatigue, which players, and positions recover well, which are taking longer. How are players coping with training, match day loads and intensity. What are players physical capabilities when pushed towards their max. Speed monitoring is one tool which can help coaches see if players bounce back from games, i.e. fixture congestion or 2/3 games a week, particularly if they come thick and fast. Recovery profiles will be different for forwards, midfielders and defenders. Different base fitness and strength levels will also be a factor. We can also see how many speed gears do players have, and if this improves over time or not. Increases in intensity and volume towards the latter part of the season can affect injury rates. Weekly speed training can help players and teams level up. More speed means everything happens faster on the pitch, and more gears can lead to more control of opponents and games.
Closing the Positional Gap
Damallsvenskan data shows across all positions, the speed gap between defenders, midfielders and forwards can close. For example positional averages over 30m for week 2 are defenders 4.75 max speed, 6.32 m/s, 22.76km/h. Midfielders 6.34m/s and forwards 6.45 m/s. Week 3, defenders 6.44m/s, midfielders 6.42m/s and forwards 6.7m/s. We now have a little gap appearing between the mid line and forwards. Week 4, Defenders 6.66m/s, midfielders 6.52m/s, and forwards 6.87m/s.
The speed gap has increased even more between the mid line and forwards. A gap is also appearing between the back line and midfield. Week 5 this starts to even out. The back line and mid line are in synch again, defenders 6.38m/s and midfielders 6.35m/s. The forwards are still ahead at 6.5m/s. Teams that are capable of moving defensive units forwards and backwards, without losing pace or intensity or increasing distances between individual and team lines is critical. Teams that have energy, lots of capability for high speed runs (HSR), sprinting are vital characteristics and the best parts of a teams armoury. (FIFA Women’s World Cup Physical Reports 2011). These weekly and individual variations will be down to legs, lungs, speed and brains. Intensity, frequency and density of training and games.
Speed Training
Short to Long
Player increases in speed week on week, means more force and load through joints and musculature. Speed is load so weekly increases in volume can create issues for individual players and teams. Hold players over prescribed distances to allow for musculature to adapt, and joints and ligaments before increasing the distance. I take the short to long approach when training speed. Acceleration first - 3 step quickness, get to the ball first. A good rule of thumb is no more than 5 metres at a time. We get faster, moving from short distances to long. i.e 10 metres, then 15 metres, then 20 metres and so on, gradual building up maximum speed over longer distances. Speed is one of the hardest components to train, so it’s a good idea to train speed first in pre-season and then keep working on it all year round. I then put endurance on top of speed. This type of approach can mirror the intensity and speed of possession and games. Working from bigger possession with less speed, intensity, braking and change of direction to higher intensities and smaller spaces. The proportion of the work just changes depending on the focus.
Page 5: All Positions Weekly Speed
Weekly speed is displayed for all positions, Individual speed results, player and positional comparisons can be made, UCL players are also listed.

Player Maximal Speed %
Page 6: - Weekly Speed Sample - Defenders
This page is linked to maximal speed GPS data, this pulls max speed data from training sessions and matches. For example a player needs to hit x3 max speed every 7 days, a minimum of 90% to 95%. This converts metres per second (m/s) into percentages. Session speed 90% over is displayed in green. White or red indicate speed under 90%. This ensures players are getting enough exposure to sprinting speeds, this can also help condition musculature, i.e. hamstrings, joints and ligaments for top end speed. Players may have to cope with two fixtures or more during the week and the intensity of competition. If players are not getting enough speed, then top ups can be applied on the pitch. Weeks and session dates can be added to the monitoring tool.

Individual Player Dashboard
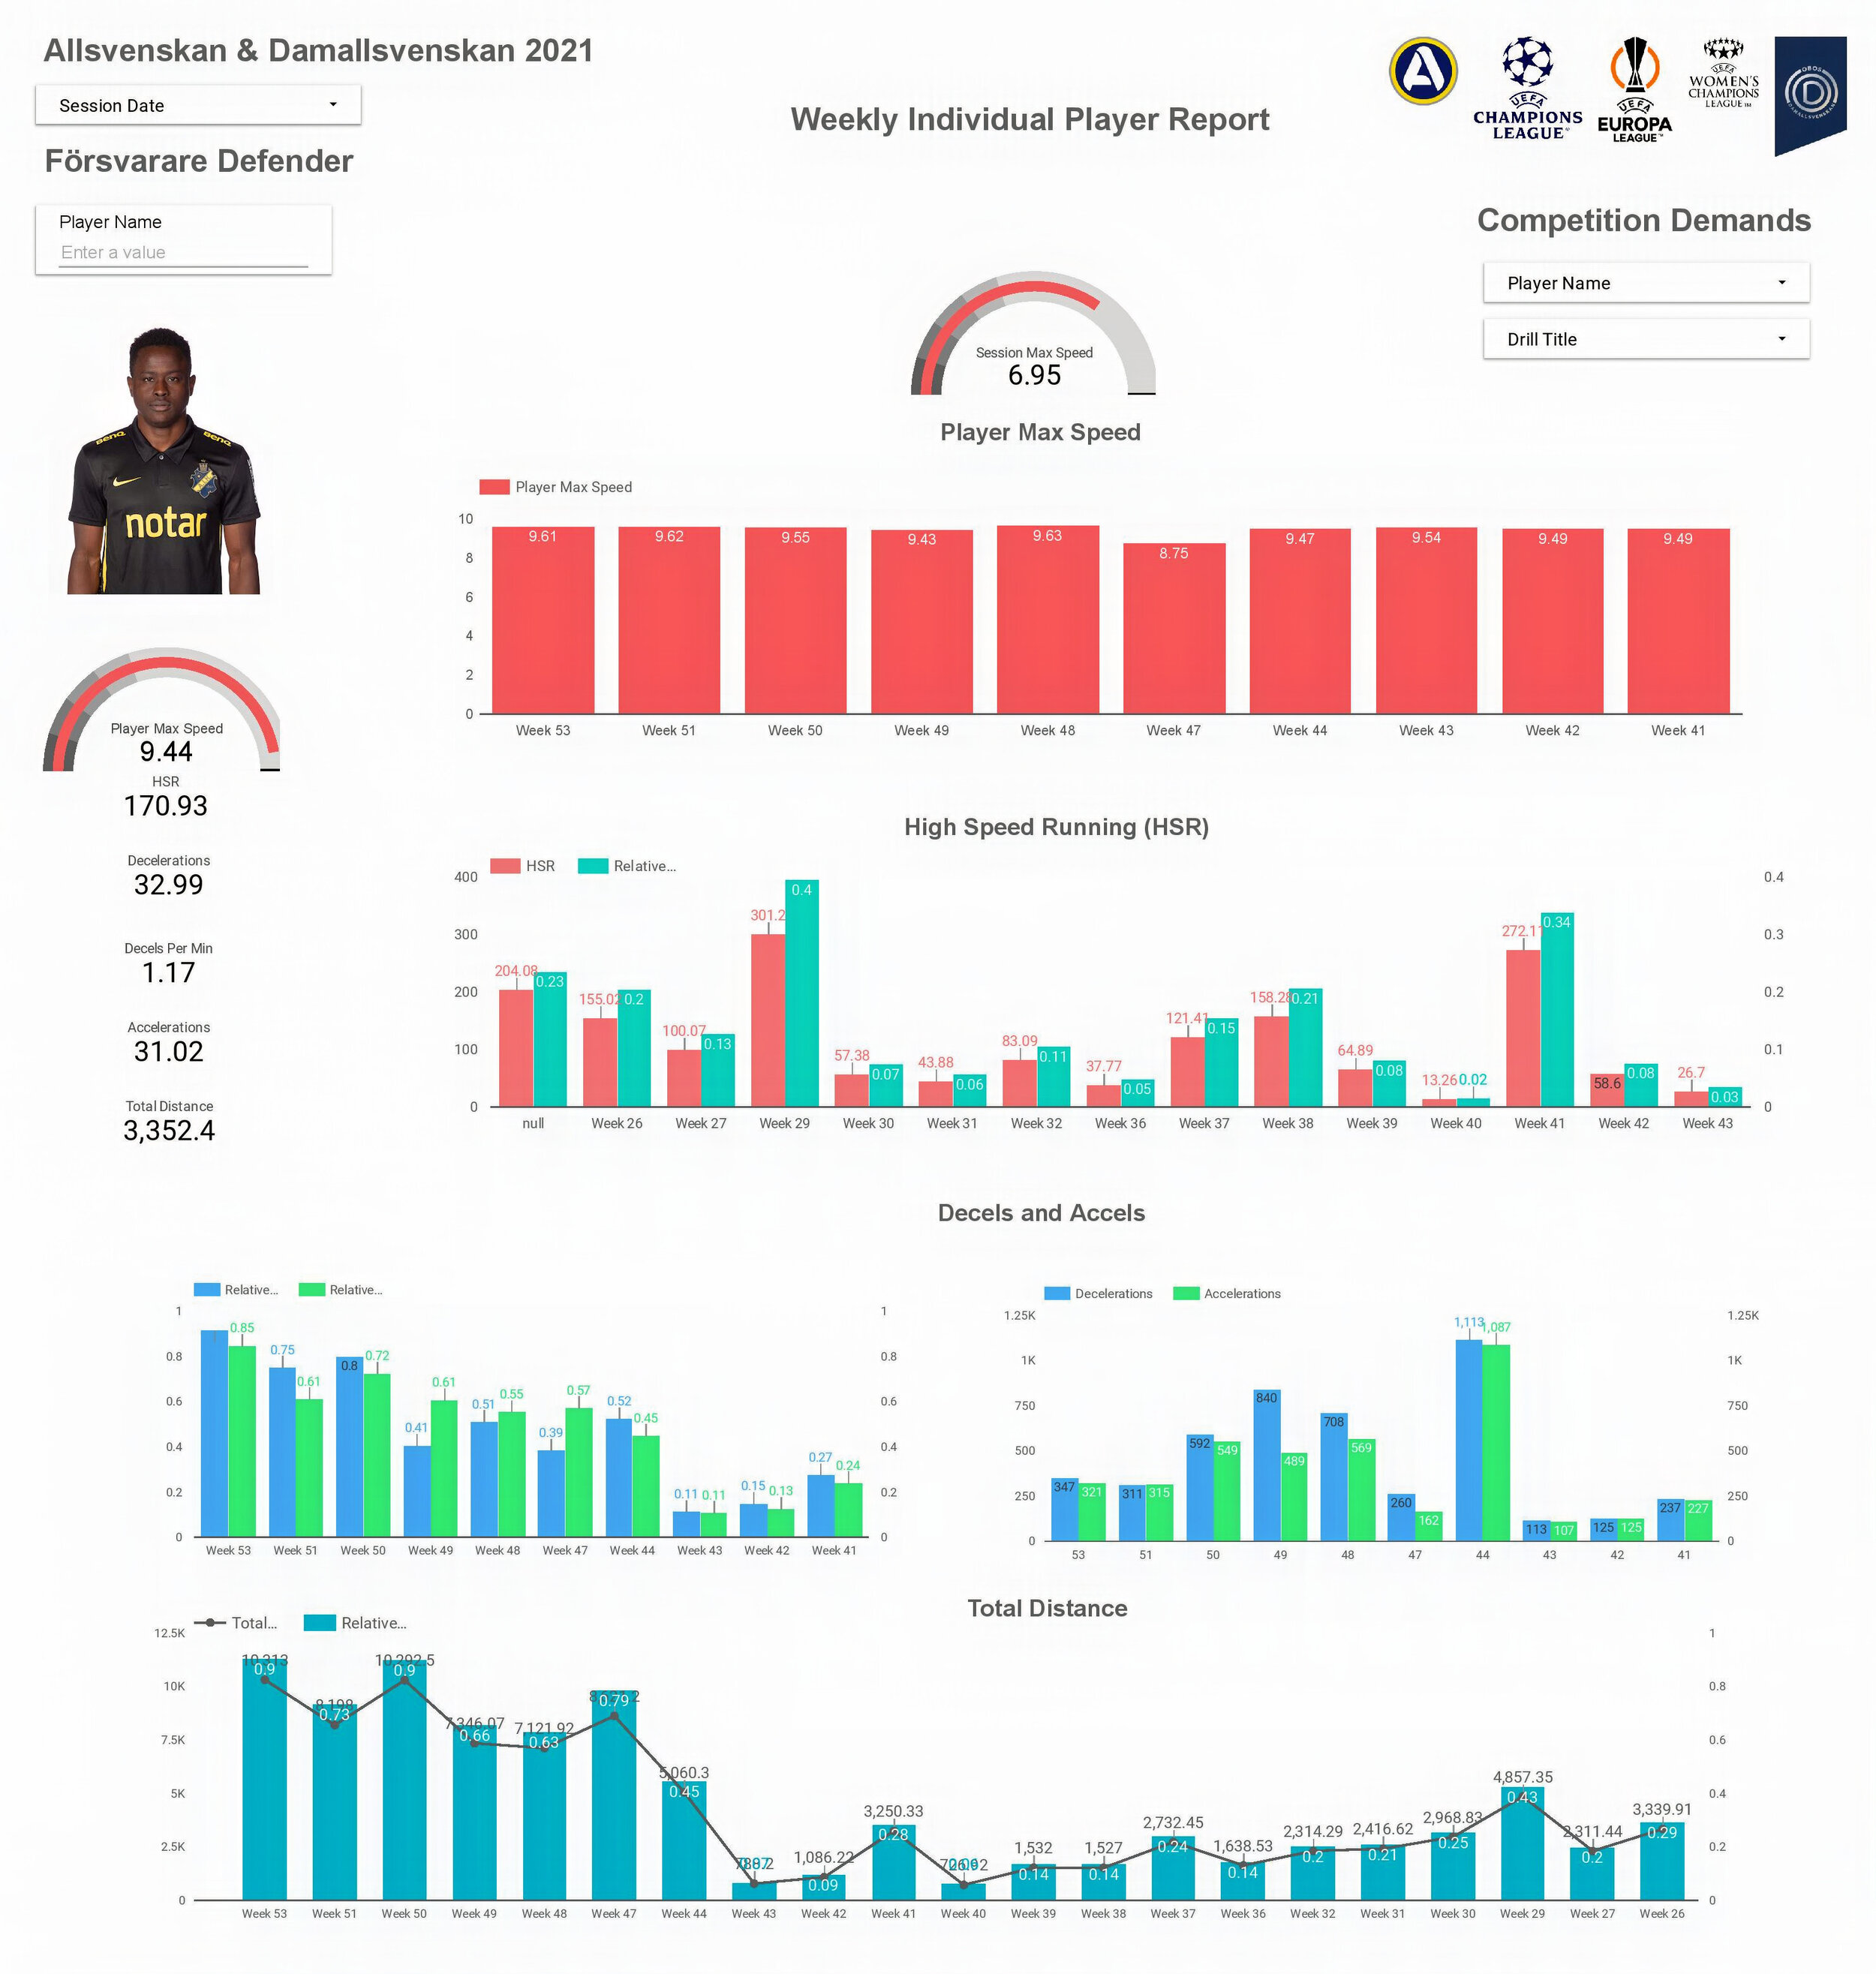
This is an example of a weekly individual player dashboard, session dates can also be selected. Any metrics can be included in the reports depending on what coaches would like to see.
For this Dashboard, select these buttons
1. Choose Player name
2. Choose Drill Title - You can select multiple drills
3. Choose the Session Date - The dates will automatically be filtered, select the dates
4. Type In Player Name - I.e Player 1 (P must be in caps, the rest lower case) This will bring up the player profile image
For each graph move the cursor and hover over the top right side, this will show up and down arrows, AZ and 3 dots. You can drill data up and down. You can drill down from the week to player positions, player position to player names, player name to drill title. You can also sort using AZ and by the 3 dots. To reset the graph click on the graph, go to the 3 dots and select reset. Any metrics can be added to drill down or up, when creating the dashboard.
Interactive Dashboard
Scroll down to the bottom right hand side of the report (Google Data Studio) and go to full screen for the best interactive experience, you can explore in Google Data Studio or just within the blog.
Final
If you wish to see more on speed then check out my force velocity video information. It is for coaches who need guidance as to what to do with the force velocity results, training and performance implications. I start with descriptives on what qualities need to be developed, depending on the results. How to optimise speed, strength or balanced profiles, if players have a major deficit, minor deficit or balanced profile. This resource and methods can all be applied to any position on the field.
The video includes, training approaches, programming, sequencing, what works. Speed, strength and power deficit exercise menus. Tools for measuring explosive power and monitoring. Plyometric progressions, over-speed, fast eccentrics, ballistics and resistance training. For more speed video resources, check out my YouTube Channel https://www.youtube.com/c/lizziefluke
Football Resources
Here you will find just some of the additional resources i have used. Plus my own knowledge and coaching experience.
Any questions and comments are welcome!
UEFA / FIFA Technical and Physical Reports
https://www.uefatechnicalreports.com/programme/2020-uefa-womens-champions-league/contents
Bundesliga
Intra-seasonal variation of injury patterns among German Bundesliga soccer players. / Leventer, L; Eek, F; Lames, In: Journal of Science and Medicine in Sport, Vol. 22, No. 6, 2019, p. 661-666.
Muscle Forces for Sprinting
New Studies in Athletics 1 (March 1995), Vol. 10, 29-49 Relative activity of hip and knee extensors in sprinting -
implications for training by Klaus Wiemann and Günter Tidow.
Hamner SR, Seth A, Delp SL. Muscle contributions to propulsion and support during running. J Biomech. 2010;43(14):2709-2716. doi:10.1016/j.jbiomech.2010.06.025.
Hamner, S.R., Delp, S.L., Muscle contributions to fore-aft and vertical body mass center accelerations over a range of running speeds. Journal of Biomechanics (2012), http://dx.doi.org/10.1016/j.jbiomech.2012.11.024.
1956 T. W. Dorn, A. G. Schache and M. G. Pandy Muscular strategy shift in human running: dependence of running speed on hip and ankle muscle performance 10.1242/jeb.075051.
Schache AG, Dorn TW, Williams GP, Brown NA, Pandy MG. Lower-limb muscular strategies for increasing running speed. J Orthop Sports Phys Ther. 2014;44(10):813-824. doi:10.2519/jospt.2014.5433.
Reilly, T. and Thomas, V. (1976) A motion analysis of work-rate in different positional roles in professional football match-play.
Journal of Human Movement Studies 2, 87-89.
Felix E. Zajac, Muscle Coordination of Movement: A Perspective, Btomechanics Vol 26, supp11,pp 109-124,1993.
Muscle Forces for Deceleration and Agility
Dalen, T, Jørgen, I, Gertjan, E, Geir Havard, H, and Ulrik, W. Player load, acceleration, and deceleration during forty-five competitive matches of elite soccer. J Strength Cond Res 30(2): 351–359, 2016.
Harper, Damian & Carling, Christopher & Kiely, John. (2019). High-Intensity Acceleration and Deceleration Demands in Elite Team Sports Competitive Match Play: A Systematic Review and Meta-Analysis of Observational Studies. Sports Medicine. 49. 10.1007/s40279-019-01170-1.
Russell M, Sparkes W, Northeast J, Cook CJ, Bracken RM, Kilduff LP. Relationships between match activities and peak power output and Creatine Kinase responses to professional reserve team soccer match-play. Hum Mov Sci. 2016;45:96–101
Varley MC, Jaspers A, Helsen WF, Malone JJ. Methodological considerations when quantifying high-intensity efforts in team sport using global positioning system technology. Int J Sports Physiol Perform. 2017;12:1059–1068.
Tierney PJ, Young A, Clarke ND, Duncan MJ. Match play demands of 11 versus 11 professional football using global positioning system tracking: variations across common playing formations. Hum Mov Sci. 2016;49:1